Welcome to OsKarT Racing, our Lad and Dad Karting Journey

Welcome to the heart of our karting adventure!

This website is a personal project, born from the pure joy of supporting my son’s passion for racing. It’s not just a collection of data; it’s a living tribute to his dedication and a dynamic tool to inspire him to continuously challenge his limits on and off the track. Beyond the thrill of speed, karting has been an incredible catalyst for his growth. I’ve witnessed firsthand his independence and confidence blossom, alongside the wonderful friendships he’s formed within the vibrant community of fellow competitors. As a racing dad, every race weekend is a privilege, watching his ability and spirit soar through every triumph and setback.

A quick note on the data: All lap times and performance metrics on this site are meticulously gathered from sessions my son and I have personally attended. This means the data is not exhaustive for other drivers, and it’s highly probable that many individuals have achieved faster times. However, this growing collation serves as an invaluable resource for understanding relative performance, learning from standout drivers, and over time, discerning the optimal karts for the best times.

Our journey to this digital hub began with cumbersome spreadsheets ‐ a system that, while functional, lacked engagement for a young racer, was incredibly time-consuming to update, and offered limited scope for meaningful analysis.

This website represents our stride towards making this data truly engaging, insightful, and easily accessible for everyone following our progress.

Join us as we track every turn, every lap, and every new personal best!😀


We thank and acknowledge the generous support of Illumin8Training, the lad’s first official sponsor.


Illuinat8Training is a leading UK provider of HESA-approved courses. You can read all about their great services and courses on their website.


TeamSport Achievements

Note: TeamSports Academy sessions run junior Karts with seniors, so top 3 places are challenging, especially in Advanced due to the number of seniors.

  • Red ribbon banner
    138 Races
    Red ribbon banner
    Best: 45.523
    Red ribbon banner
    24 Podiums
  • Gold Trophy
    9
  • Silver Trophy
    8
  • Bronze Trophy
    7

Results

This page lists the individual results included in the scope of this website.

Please note: the results per session are listed in the order they are based solely on the fastest lap time per cadet in the session. This means the order may well be different to the actual finishing position in a race.


April Events

  • Academy Session 1
    DriverKartTime
    MIO3245.588
    YMV2947.323
    KVU3147.426
    OST2348.182
    FCD2848.182
    ASN3448.209
    AKD2548.471
  • Grid Start Race
    DriverKartTime
    KVU3245.069
    YMV2545.427
    FCD3146.443
    AKD3447.581
    OST2947.591
    ASN2347.682

March Events

  • Academy Session 1
    DriverKartTime
    YMV3345.145
    OST2445.596
    AYB3247.096
    KVU2348.500
  • Academy Session 2
    DriverKartTime
    YMV3244.809
    OST3445.111
    KVU2445.813
    AYB3347.151
  • Academy League Quali
    DriverKartTime
    OST3445.800
    FCR2447.470
    SDL2549.004
  • Academy League Final
    DriverKartTime
    OST3345.527
    FCR3447.480
    SDL2947.739

  • Academy Session 1
    DriverKartTime
    OSS3244.401
    OST2445.451
    IGR2745.591
    ABL3345.712
    AKD2346.244
  • Academy Session 2
    DriverKartTime
    OSS3444.524
    ABL2445.103
    OST3245.141
    IGR2745.595
    AKD2346.491

  • Academy Session 1
    DriverKartTime
    OST2645.276
    FCR2946.396
    AYB3146.899
    YMV2847.712
    AVH2448.318
  • Grid Start Race
    DriverKartTime
    YMV3144.521
    OST2645.363
    FCR3446.294
    AYB2946.650
    AVH2447.320

  • Academy Session 1
    DriverKartTime
    OSS3444.499
    IGR2945.439
    OST2645.661
    MSG2346.047
    AKD3346.196
    ABL2847.001
    ASN3247.070
    FCD3147.116
    YMV2747.723
  • Grid Start Race
    DriverKartTime
    OSS2944.172
    MSG3445.509
    ABL3245.537
    FCD2445.699
    AKD3345.838
    IGR2846.720
    ASN2346.966
    YMV2747.131
    OST3147.329

  • Academy Session 1
    DriverKartTime
    OST2645.301
    MIO2746.038
    AKD2946.143
    OSS3146.594
    FCR2446.935
  • Grid Start Race
    DriverKartTime
    OST2645.052
    OSS3345.406
    MIO3145.527
    AKD3445.751
    FCR2446.847

February Events

  • Academy Session 1
    DriverKartTime
    MIO2944.558
    OSS3245.188
    DWT3445.605
    OST2345.839
    FCR2645.942
    ASN3346.488
    ABL3146.527
    AKD2446.776
    FIN2746.998
    LFR3047.822
  • Grid Start Race
    DriverKartTime
    OSS2344.198
    LFR2944.822
    OST3445.420
    DWT3246.312
    FIN3146.453
    ASN2446.673
    ABL2746.691
    MIO3046.739
    AKD2646.776
    FCR3346.928

  • Academy Session 1
    DriverKartTime
    FCD2944.851
    OSS3444.876
    ABL2344.966
    MIO2445.267
    OST3245.387
    LFR2646.766
    ELD3047.089
    ASN3347.279
    AKD2747.512
  • Grid Start Race
    DriverKartTime
    OST3245.283
    FCD2945.313
    MIO3045.410
    OSS2745.417
    LFR2345.434
    ABL3346.301
    ASN2646.557
    ELD2446.833
    AKD3446.893

January Events

  • Academy Session 1
    DriverKartTime
    OSS2444.023
    LFR2344.933
    ABL3445.631
    OST3146.002
    ELD2646.770
    ASN2947.245
    FCR3248.662
  • Grid Start Race
    DriverKartTime
    LFR2444.382
    OSS3244.537
    ABL2344.856
    OST2945.320
    ELD3446.255
    ASN2646.833
    AKD2747.490
    FCR3149.946

December Events

  • Academy Session 1
    DriverKartTime
    OSS3244.846
    VBW2445.755
    MIO3445.762
    ABL3345.894
    IGR3045.938
    SIV2946.293
    LFR2346.928
    ELD2749.359
    OST3149.512
  • Grid Start Race
    DriverKartTime
    OSS3244.857
    IGR3445.410
    MIO2445.651
    ABL2946.369
    VBW2746.549
    LFR2646.631
    SIV3346.714
    ELD3047.072
    OST2552.773

  • Academy Session 1
    DriverKartTime
    MIO3244.908
    LFR2945.078
    OSS2745.124
    OST3345.436
    IGR3045.684
    HBN3146.876
    LCC2647.356
    ASN2347.795
  • Grid Start Race
    DriverKartTime
    OSS3244.466
    LFR2944.509
    HBN2744.619
    MIO3445.153
    OST2345.734
    IGR3146.738
    ASN3347.244
    LCC2647.303

November Events

  • Academy Session 1
    DriverKartTime
    IGR2445.353
    LFR3445.909
    ABL2946.317
    MIO2746.662
    OST3348.353
    AAJ2648.353
    LCC3049.023
  • Grid Start Race
    DriverKartTime
    IGR3445.478
    AAJ2445.924
    MIO2746.470
    OST3046.946
    ABL2946.969
    LFR3147.346
    LCC2648.672

  • Academy Session 1
    DriverKartTime
    OSS2444.525
    MIO3245.605
    OST3446.018
    HBN2346.602
    IGR2647.393
    LCC2947.444
    KVU3348.410
  • Grid Start Race
    DriverKartTime
    OSS3444.419
    MIO2445.196
    IGR2945.341
    LCC3246.484
    OST2347.422
    HBN3347.528
    KVU2747.582

  • Academy Session 1
    DriverKartTime
    ALK3145.642
    LFR3346.216
    OST3046.224
    JPS2446.488
    ABL2946.622
    ASN3247.029
    OSS3447.132
    LCC2747.148
    AKD2347.710
  • Grid Start Race
    DriverKartTime
    ALK3045.016
    LFR3245.060
    OSS3145.415
    AKD2445.559
    OST2945.666
    ABL3346.534
    LCC2746.815
    JPS2347.411
    ASN3448.421

  • Academy Session 1
    DriverKartTime
    PKA3044.872
    OSS2745.277
    ABL2445.631
    HBN2345.707
    VBW3245.864
    MIO2945.931
    OST3446.447
    IGR3146.447
    LCC2648.631
    JQN2548.847
  • Grid Start Race
    DriverKartTime
    OSS2444.747
    OST3244.996
    HBN3045.107
    IGR2945.546
    VBW2745.960
    MIO2346.428
    ABL3446.487
    JQN2646.611
    PKA3146.703
    LCC2551.156

October Events

  • Academy Session 1
    DriverKartTime
    OSS2944.356
    PKA2445.438
    OST2346.294
    KVU3046.866
    ABL3447.033
    VBW2747.265
    AKD3348.367
  • Rolling Race
    DriverKartTime
    OST2944.860
    KVU2445.947
    ABL2346.211
    OSS3346.517
    PKA3446.679
    AKD2746.849
    VBW3047.005

  • Grid Start Race
    DriverKartTime
    JQN3244.584
    KVU2944.923
    ABL2446.529
    OST3046.530
    LLY2548.066

  • Academy Session 1
    DriverKartTime
    JQN3244.385
    ADR2944.614
    MSG3445.091
    IGR3045.963
    OST2446.072
    PKA2746.115
    ELD3146.687
  • Grid Start Race
    DriverKartTime
    JQN3144.859
    IGR3245.348
    MSG3045.611
    ADR3446.057
    ELD2946.076
    PKA2446.114
    OST2746.126

September Events

  • Academy Session 1
    DriverKartTime
    OSN2444.326
    OSS2345.243
    MSG3345.250
    ALK2545.438
    JQN3445.619
    IGR3045.978
    OST2646.585
  • Grid Start Race
    DriverKartTime
    OSS2444.453
    OSN2645.141
    MSG3345.148
    OST2945.186
    IGR3445.308
    ALK2545.449
    JQN3045.768

  • Academy Session 1
    DriverKartTime
    OSN3244.521
    JQN2444.880
    MSG3145.252
    IGR2745.636
    ABL2946.404
    ADR3346.525
    OST2646.902
    OSS3047.764
  • Rolling Race
    DriverKartTime
    ADR3144.594
    OSS3244.875
    OST2444.892
    ABL2745.824
    OSN2545.859
    IGR2946.398
    MSG3346.922
    JQN2647.420

August Events

  • Academy Session 1
    DriverKartTime
    MES3243.992
    JQN2444.762
    OSN2745.375
    MSG2645.965
    ALK3145.974
    ABL2946.600
    OST3147.082
    ELD2547.380
  • Grid Start Race
    DriverKartTime
    MSG3244.855
    MES3345.128
    ELD2446.213
    ALK2546.215
    OST2646.791
    JQN2746.990
    ABL2947.023
    OSN3447.449

  • Academy Session 1
    DriverKartTime
    SDL2544.221
    MES2944.908
    OSS2445.162
    ADR2645.164
    MSG3245.234
    IGR3145.513
    JQN3047.610
    OST2351.391
  • Grid Start Race
    DriverKartTime
    MSG2444.675
    ADR2544.809
    MES3345.057
    SDL2645.105
    IGR2745.242
    JQN3145.372
    OSS3046.291
    OST2946.659

  • Academy Session 1
    DriverKartTime
    SDL3244.277
    OSS3144.477
    MSG2745.119
    MES3445.167
    OST2946.480
  • Academy Session 2
    DriverKartTime
    OSS3344.537
    SDL2744.540
    MES3244.558
    MSG2646.328
    OST3446.500

  • Academy Session 1
    DriverKartTime
    OSS2745.320
    MSG2545.493
    OST3247.797
  • Academy Session 2
    DriverKartTime
    OSS3244.802
    MSG2745.322
    OST2445.911

  • Academy Session 1
    DriverKartTime
    OSS3245.473
    OST2547.966
  • Academy Session 2
    DriverKartTime
    OSS3245.016
    OST3345.523

July Events

  • Academy Session 1
    DriverKartTime
    OSS3247.524
    MSG3348.065
    OST2448.769
    ELD2949.510
    JQN2649.788
  • Grid Start Race
    DriverKartTime
    OSS3347.320
    OST2947.771
    MSG3247.925
    JQN3048.693
    ELD2449.253

  • Academy Session 1
    DriverKartTime
    JQN2546.847
    MSG3247.317
    ADR2347.419
    OST3347.678
    ALK2447.727
    IGR2948.742
  • Grid Start Race
    DriverKartTime
    ADR2947.303
    IGR3347.317
    OST2547.432
    MSG3047.994
    JQN2348.361
    ALK3149.011

June Events

  • Grid Start Race
    DriverKartTime
    OSS3347.138
    ALK3147.416
    JQN2947.557
    OST3247.588
    IGR2347.829
    MSG2748.127
  • Rolling Race
    DriverKartTime
    JQN3147.113
    IGR3347.164
    MSG3247.168
    OSS2347.532
    ALK2948.023
    OST2748.991

  • Rolling Race
    DriverKartTime
    MSG3347.226
    OST3347.542

  • Academy Session 1
    DriverKartTime
    ALK2546.636
    OST2447.854
    MSG3047.893
    IGR2348.746
    OSS2748.774
  • Grid Start Race
    DriverKartTime
    OSS2546.992
    IGR2347.358
    MSG3347.811
    OST2447.848
    ALK2649.527

  • Academy Session 1
    DriverKartTime
    IGR3346.851
    MSG3147.112
    OST2747.188
  • Grid Start Race
    DriverKartTime
    IGR3346.747
    OST2547.063
    MSG2347.746

  • Academy Session 1
    DriverKartTime
    ALK3346.900
    ADR2646.996
    MSG3047.914
    OST2347.965
    IGR2448.098
  • Grid Start Race
    DriverKartTime
    ALK2347.198
    OST3347.375
    ADR2447.431
    MSG2547.872
    IGR2948.635

May Events

  • Academy Session 1
    DriverKartTime
    MSG3346.934
    OSS2546.961
    OST3047.255
  • Academy Session 2
    DriverKartTime
    OSS2546.859
    MSG3047.009
    OST2747.164

  • Academy Session 1
    DriverKartTime
    MSG2647.374
    IGR2447.524
    OST3448.361
    OSS2748.548
  • Academy Session 2
    DriverKartTime
    OST2747.266
    MSG2447.765
    IGR2947.779
    OSS2648.985

  • Academy Session 1
    DriverKartTime
    IGR2947.677
    OST3047.973
    MSG2448.133
    MSA2348.523
    ELS3248.907
    OSS2649.064
  • Academy Session 2
    DriverKartTime
    IGR2447.336
    OSS2947.431
    MSG2647.593
    OST3247.599
    MSA3048.358
    ELS2349.590

  • Academy Session 1
    DriverKartTime
    OSS3347.487
    OST2747.608
    LLY3447.647
    ALK2948.723
  • Academy Session 2
    DriverKartTime
    LLY3346.664
    ALK2546.867
    OSS3347.084
    MSG2747.163
    OST2647.696

April Events

  • Academy Session 1
    DriverKartTime
    OST2947.686
    IGR2749.607
  • Academy Session 2
    DriverKartTime
    OSS3247.864
    OST3447.986

  • Academy Session 2
    DriverKartTime
    ADR3346.816
    OST2548.285
    MSG2750.543

  • Academy Session 1
    DriverKartTime
    OST3048.056
    OSS2450.361
  • Academy Session 2
    DriverKartTime
    OST2947.933
    OSS3048.348

March Events

  • Academy Session 1
    DriverKartTime
    IGR3247.778
    OST3048.403
    OSS3449.028
  • Academy Session 2
    DriverKartTime
    OSS3247.359
    OST3347.749
    IGR3147.997

  • Grid Start Race
    DriverKartTime
    CSY2547.162
    OSS2747.605
    OST2647.755
    ALK3348.289
    IGR3448.303
  • Rolling Race
    DriverKartTime
    IGR2547.390
    CSY3447.448
    OSS3347.479
    ALK2747.527
    OST2647.597

  • Academy Session 1
    DriverKartTime
    OSS3348.043
    OST2449.816
  • Academy Session 2
    DriverKartTime
    OST3048.247
    OSS3348.249

  • Academy Session 1
    DriverKartTime
    OST3248.503
    ELS2650.977

  • Grid Start Race
    DriverKartTime
    CSY3247.309
    ALK3347.499
    DNL3448.034
    IGR3148.991
    OST3049.228
    HZR2451.799

  • Academy Session 1
    DriverKartTime
    OST2754.249
  • Academy Session 2
    DriverKartTime
    OST2946.958

  • Academy Session 1
    DriverKartTime
    IGR3348.149
    ELS3249.874
    OST2855.287
  • Academy Session 2
    DriverKartTime
    IGR2946.775
    ELS3249.031
    OST3050.160

February Events

  • Academy Session 1
    DriverKartTime
    OST3348.174
    IGR3049.025

  • Academy Session 1
    DriverKartTime
    OSS2946.692
    IGR3047.368
    OST2548.859
  • Academy Session 2
    DriverKartTime
    IGR2846.340
    OSS3347.321
    OST3247.907

Events

List of events covered in this test

2026 Monthly Top Three Drivers

MonthPosDriverKartTimeDate
April1stKVU3245.06912 Apr
2ndYMV2545.42712 Apr
3rdMIO3245.58812 Apr
March1stOSS2944.17215 Mar
2ndYMV3144.52116 Mar
3rdOST2645.05201 Mar
February1stOSS2344.19815 Feb
2ndMIO2944.55815 Feb
3rdLFR2944.82215 Feb
January1stOSS2444.02318 Jan
2ndLFR2444.38218 Jan
3rdABL2344.85618 Jan

2025 Monthly Top Three Drivers

MonthPosDriverKartTimeDate
December1stOSS3244.46607 Dec
2ndLFR2944.50907 Dec
3rdHBN2744.61907 Dec
November1stOSS3444.41923 Nov
2ndPKA3044.87202 Nov
3rdOST3244.99602 Nov
October1stOSS2944.35626 Oct
2ndJQN3244.38512 Oct
3rdADR2944.61412 Oct
September1stOSN2444.32614 Sep
2ndOSS2444.45314 Sep
3rdADR3144.59407 Sep
August1stMES3243.99231 Aug
2ndSDL2544.22124 Aug
3rdOSS3144.47718 Aug
July1stJQN2546.84713 Jul
2ndADR2947.30313 Jul
3rdIGR3347.31713 Jul
June1stALK2546.63615 Jun
2ndIGR3346.74708 Jun
3rdOSS2546.99215 Jun
May1stLLY3346.66404 May
2ndOSS2546.85925 May
3rdALK2546.86704 May
April1stADR3346.81620 Apr
2ndOST2947.68627 Apr
3rdOSS3247.86427 Apr
March1stIGR2946.77502 Mar
2ndOST2946.95809 Mar
3rdCSY2547.16224 Mar
February1stIGR2846.34009 Feb
2ndOSS2946.69209 Feb
3rdOST3247.90709 Feb


Monthly Race Winners

DateEvent TypeVenueDriverKartTimeAvg TimeCdt Karts
12th AprGrid Start RaceTeamSport LeicesterKVU3245.06946.6326
12th AprAcademy Session 1TeamSport LeicesterMIO3245.58847.6267

DateEvent TypeVenueDriverKartTimeAvg TimeCdt Karts
30th MarAcademy League FinalTeamSport LeicesterOST3345.52746.9153
30th MarAcademy League QualiTeamSport LeicesterOST3445.80047.4253
30th MarAcademy Session 2TeamSport LeicesterYMV3244.80945.7214
30th MarAcademy Session 1TeamSport LeicesterYMV3345.14546.5844
29th MarAcademy Session 2TeamSport LeicesterOSS3444.52445.3715
29th MarAcademy Session 1TeamSport LeicesterOSS3244.40145.4805
16th MarAcademy Session 1TeamSport LeicesterOST2645.27646.9205
16th MarGrid Start RaceTeamSport LeicesterYMV3144.52146.0305
15th MarAcademy Session 1TeamSport LeicesterOSS3444.49946.3069
15th MarGrid Start RaceTeamSport LeicesterOSS2944.17246.1009
1st MarGrid Start RaceTeamSport LeicesterOST2645.05245.7175
1st MarAcademy Session 1TeamSport LeicesterOST2645.30146.2025

DateEvent TypeVenueDriverKartTimeAvg TimeCdt Karts
15th FebGrid Start RaceTeamSport LeicesterOSS2344.19846.10110
15th FebAcademy Session 1TeamSport LeicesterMIO2944.55846.17410
1st FebGrid Start RaceTeamSport LeicesterOST3245.28345.9389
1st FebAcademy Session 1TeamSport LeicesterFCD2944.85145.9999

DateEvent TypeVenueDriverKartTimeAvg TimeCdt Karts
18th JanGrid Start RaceTeamSport LeicesterLFR2444.38246.2028
18th JanAcademy Session 1TeamSport LeicesterOSS2444.02346.1817

DateEvent TypeVenueDriverKartTimeAvg TimeCdt Karts
21st DecGrid Start RaceTeamSport LeicesterOSS3244.85746.8929
21st DecAcademy Session 1TeamSport LeicesterOSS3244.84646.6999
7th DecGrid Start RaceTeamSport LeicesterOSS3244.46645.7218
7th DecAcademy Session 1TeamSport LeicesterMIO3244.90846.0328

DateEvent TypeVenueDriverKartTimeAvg TimeCdt Karts
30th NovGrid Start RaceTeamSport LeicesterIGR3445.47846.8297
30th NovAcademy Session 1TeamSport LeicesterIGR2445.35347.1397
23rd NovGrid Start RaceTeamSport LeicesterOSS3444.41946.2827
23rd NovAcademy Session 1TeamSport LeicesterOSS2444.52546.5717
9th NovGrid Start RaceTeamSport LeicesterALK3045.01646.2119
9th NovAcademy Session 1TeamSport LeicesterALK3145.64246.6909
2nd NovGrid Start RaceTeamSport LeicesterOSS2444.74746.37410
2nd NovAcademy Session 1TeamSport LeicesterPKA3044.87246.36510

DateEvent TypeVenueDriverKartTimeAvg TimeCdt Karts
26th OctRolling RaceTeamSport LeicesterOST2944.86046.2957
26th OctAcademy Session 1TeamSport LeicesterOSS2944.35646.5177
19th OctGrid Start RaceTeamSport LeicesterJQN3244.58446.1265
12th OctGrid Start RaceTeamSport LeicesterJQN3144.85945.7427
12th OctAcademy Session 1TeamSport LeicesterJQN3244.38545.5617

DateEvent TypeVenueDriverKartTimeAvg TimeCdt Karts
14th SepGrid Start RaceTeamSport LeicesterOSS2444.45345.2087
14th SepAcademy Session 1TeamSport LeicesterOSN2444.32645.4917
7th SepRolling RaceTeamSport LeicesterADR3144.59445.8488
7th SepAcademy Session 1TeamSport LeicesterOSN3244.52145.9868

DateEvent TypeVenueDriverKartTimeAvg TimeCdt Karts
31st AugGrid Start RaceTeamSport LeicesterMSG3244.85546.3338
31st AugAcademy Session 1TeamSport LeicesterMES3243.99245.8918
24th AugGrid Start RaceTeamSport LeicesterMSG2444.67545.4018
24th AugAcademy Session 1TeamSport LeicesterSDL2544.22146.1508
18th AugAcademy Session 1TeamSport LeicesterSDL3244.27745.3336
18th AugAcademy Session 2TeamSport LeicesterOSS3344.53745.2935
17th AugAcademy Session 2TeamSport LeicesterOSS3244.80245.3453
17th AugAcademy Session 1TeamSport LeicesterOSS2745.32046.2033
10th AugAcademy Session 2TeamSport LeicesterOSS3245.01645.2692
10th AugAcademy Session 1TeamSport LeicesterOSS3245.47346.7192

DateEvent TypeVenueDriverKartTimeAvg TimeCdt Karts
27th JulGrid Start RaceTeamSport LeicesterOSS3347.32048.1925
27th JulAcademy Session 1TeamSport LeicesterOSS3247.52448.7315
13th JulGrid Start RaceTeamSport LeicesterADR2947.30347.9036
13th JulAcademy Session 1TeamSport LeicesterJQN2546.84747.6226

DateEvent TypeVenueDriverKartTimeAvg TimeCdt Karts
29th JunGrid Start RaceTeamSport LeicesterOSS3347.13847.6096
29th JunRolling RaceTeamSport LeicesterJQN3147.11347.6656
22nd JunRolling RaceTeamSport LeicesterOST3347.54247.5932
22nd JunRolling RaceTeamSport LeicesterMSG3347.22647.5892
15th JunGrid Start RaceTeamSport LeicesterOSS2546.99247.9075
15th JunAcademy Session 1TeamSport LeicesterALK2546.63647.9815
8th JunGrid Start RaceTeamSport LeicesterIGR3346.74747.1853
8th JunAcademy Session 1TeamSport LeicesterIGR3346.85147.0503
1st JunGrid Start RaceTeamSport LeicesterALK2347.19847.7025
1st JunAcademy Session 1TeamSport LeicesterALK3346.90047.5755

DateEvent TypeVenueDriverKartTimeAvg TimeCdt Karts
25th MayAcademy Session 2TeamSport LeicesterOSS2546.85947.0113
25th MayAcademy Session 1TeamSport LeicesterMSG3346.93447.0503
18th MayAcademy Session 2TeamSport LeicesterOST2747.26647.9494
18th MayAcademy Session 1TeamSport LeicesterMSG2647.37447.9524
11th MayAcademy Session 2TeamSport LeicesterIGR2447.33647.9846
11th MayAcademy Session 1TeamSport LeicesterIGR2947.67748.3796
4th MayAcademy Session 2TeamSport LeicesterLLY3346.66447.0955
4th MayAcademy Session 1TeamSport LeicesterOSS3347.48747.8664

DateEvent TypeVenueDriverKartTimeAvg TimeCdt Karts
27th AprAcademy Session 2TeamSport LeicesterOSS3247.86447.9252
27th AprAcademy Session 1TeamSport LeicesterOST2947.68648.6462
20th AprAcademy Session 2TeamSport LeicesterADR3346.81648.5483
13th AprAcademy Session 2TeamSport LeicesterOST2947.93348.1402
13th AprAcademy Session 1TeamSport LeicesterOST3048.05649.2082

DateEvent TypeVenueDriverKartTimeAvg TimeCdt Karts
30th MarAcademy Session 2TeamSport LeicesterOSS3247.35947.7023
30th MarAcademy Session 1TeamSport LeicesterIGR3247.77848.4033
24th MarGrid Start RaceTeamSport LeicesterCSY2547.16247.8235
24th MarRolling RaceTeamSport LeicesterIGR2547.39047.4885
23rd MarAcademy Session 2TeamSport LeicesterOST3048.24748.2482
23rd MarAcademy Session 1TeamSport LeicesterOSS3348.04348.9302
16th MarAcademy Session 1TeamSport LeicesterOST3248.50349.7402
10th MarGrid Start RaceTeamSport LeicesterALK3347.49949.5276
10th MarGrid Start RaceTeamSport LeicesterCSY3247.30949.6556
9th MarAcademy Session 2TeamSport LeicesterOST2946.95846.9581
9th MarAcademy Session 1TeamSport LeicesterOST2754.24954.2491
2nd MarAcademy Session 2TeamSport LeicesterIGR2946.77548.6553
2nd MarAcademy Session 1TeamSport LeicesterIGR3348.14951.1033

DateEvent TypeVenueDriverKartTimeAvg TimeCdt Karts
23rd FebAcademy Session 1TeamSport LeicesterOST3348.17448.6002
9th FebAcademy Session 1TeamSport LeicesterOSS2946.69247.6403
9th FebAcademy Session 2TeamSport LeicesterIGR2846.34047.1893

Drivers

List of drivers covered in this test, along with their fastest recorded times per kart.

    • OST
    • PB Kart: 29
    • PB Date: 26th of Oct `25
    • Red ribbon banner
      Best PB: 44.86
    • Red ribbon banner
      Avg Best: 47.281
    • Red ribbon banner
      94 Races
    • Red ribbon banner
      56 Podiums
    • Gold Trophy
      17
    • Silver Trophy
      19
    • Bronze Trophy
      20
Kart232425262728293031323334
PB45.73444.89247.06345.05246.12655.28744.86046.22446.00244.99645.43645.111
Avg47.54747.01648.73046.36248.37055.28746.54948.06647.48146.68947.04046.455
Count7106117112114998

Driver Relative Performance Analysis

Comparison of the average delta time difference against each driver,
where drivers have used the same kart number on the same day.

Deficit (Slower) Advantage (Faster)
FCR(4)
2.467
LCC(1)
2.077
AYB(1)
1.624
ASN(4)
1.324
ELS(1)
1.308
ELD(2)
1.111
VBW(1)
0.868
MSA(1)
0.385
KVU(1)
0.217
DWT(1)
0.185
ABL(4)
0.141
PKA(2)
0.015
-0.026
JQN(3)
-0.213
FCD(1)
-0.325
YMV(2)
-0.361
IGR(1)
-0.519
MSG(6)
-0.82
HBN(1)
-0.844
OSS(7)
-0.889
ALK(4)
-1.444
OSN(1)
-1.542
MES(2)

Interpretation Key:

  • Green Bar (Right): On average, driver OST was faster than the other driver.
  • Red Bar (Left): On average, driver OST was slower than the other driver.
    • OSS
    • PB Kart: 24
    • PB Date: 18th of Jan `26
    • Red ribbon banner
      Best PB: 44.023
    • Red ribbon banner
      Avg Best: 46.213
    • Red ribbon banner
      61 Races
    • Red ribbon banner
      50 Podiums
    • Gold Trophy
      29
    • Silver Trophy
      15
    • Bronze Trophy
      6
Kart232425262728293031323334
PB44.19844.02346.85948.98545.124n/a44.17246.29144.47744.40144.53744.419
Avg45.65845.54546.93749.02446.581n/a45.66347.46845.49545.47846.96245.746
Count36327043313116

Driver Relative Performance Analysis

Comparison of the average delta time difference against each driver,
where drivers have used the same kart number on the same day.

Deficit (Slower) Advantage (Faster)
FCR(1)
4.125
AKD(3)
1.987
JQN(1)
1.319
ASN(1)
1.289
DWT(1)
1.124
ABL(1)
0.884
OST(7)
0.844
VBW(1)
0.683
IGR(5)
0.451
LFR(1)
0.359
ALK(4)
0.151
MIO(3)
0.015
-0.202
MSG(7)
-0.241
OSN(2)
-0.505
HBN(1)
-0.622
LLY(2)

Interpretation Key:

  • Green Bar (Right): On average, driver OSS was faster than the other driver.
  • Red Bar (Left): On average, driver OSS was slower than the other driver.
    • IGR
    • PB Kart: 27
    • PB Date: 24th of Aug `25
    • Red ribbon banner
      Best PB: 45.242
    • Red ribbon banner
      Avg Best: 46.932
    • Red ribbon banner
      48 Races
    • Red ribbon banner
      26 Podiums
    • Gold Trophy
      11
    • Silver Trophy
      10
    • Bronze Trophy
      5
Kart232425262728293031323334
PB47.35845.35347.39047.39345.24246.34045.34145.68445.51345.34846.74745.308
Avg47.97847.07847.39047.39346.33446.53046.92646.65947.47046.56347.24646.125
Count341152966254

Driver Relative Performance Analysis

Comparison of the average delta time difference against each driver,
where drivers have used the same kart number on the same day.

Deficit (Slower) Advantage (Faster)
LCC(1)
2.103
ELD(1)
1.134
AAJ(1)
0.571
LFR(1)
0.431
MIO(2)
0.368
OST(1)
0.361
PKA(1)
0.256
MSG(3)
0.229
ABL(3)
0.158
HBN(1)
0.138
-0.251
JQN(4)
-0.451
OSS(5)
-0.542
CSY(2)
-1.053
ADR(2)

Interpretation Key:

  • Green Bar (Right): On average, driver IGR was faster than the other driver.
  • Red Bar (Left): On average, driver IGR was slower than the other driver.
    • MSG
    • PB Kart: 24
    • PB Date: 24th of Aug `25
    • Red ribbon banner
      Best PB: 44.675
    • Red ribbon banner
      Avg Best: 46.793
    • Red ribbon banner
      38 Races
    • Red ribbon banner
      29 Podiums
    • Gold Trophy
      5
    • Silver Trophy
      9
    • Bronze Trophy
      15
Kart232425262728293031323334
PB46.04744.67545.49345.96545.119n/a47.64445.61145.25244.85545.14845.091
Avg46.89646.85846.68346.81547.255n/a47.64447.28446.18246.50046.76545.300
Count232450152572

Driver Relative Performance Analysis

Comparison of the average delta time difference against each driver,
where drivers have used the same kart number on the same day.

Deficit (Slower) Advantage (Faster)
ASN(1)
0.919
OST(6)
0.519
OSS(7)
0.202
-0.03
ADR(3)
-0.229
IGR(3)
-0.579
SDL(1)
-0.863
MES(1)

Interpretation Key:

  • Green Bar (Right): On average, driver MSG was faster than the other driver.
  • Red Bar (Left): On average, driver MSG was slower than the other driver.
    • LLY
    • PB Kart: 33
    • PB Date: 4th of May `25
    • Red ribbon banner
      Best PB: 46.664
    • Red ribbon banner
      Avg Best: 47.459
    • Red ribbon banner
      3 Races
    • Red ribbon banner
      2 Podiums
    • Gold Trophy
      1
    • Silver Trophy
      0
    • Bronze Trophy
      1
Kart232425262728293031323334
PBn/an/a48.066n/an/an/an/an/an/an/a46.66447.647
Avgn/an/a48.066n/an/an/an/an/an/an/a46.66447.647
Count001000000011

Driver Relative Performance Analysis

Comparison of the average delta time difference against each driver,
where drivers have used the same kart number on the same day.

Deficit (Slower) Advantage (Faster)
OSS(2)
0.622

Interpretation Key:

  • Green Bar (Right): On average, driver LLY was faster than the other driver.
  • Red Bar (Left): On average, driver LLY was slower than the other driver.
    • ALK
    • PB Kart: 30
    • PB Date: 9th of Nov `25
    • Red ribbon banner
      Best PB: 45.016
    • Red ribbon banner
      Avg Best: 47.148
    • Red ribbon banner
      20 Races
    • Red ribbon banner
      9 Podiums
    • Gold Trophy
      6
    • Silver Trophy
      3
    • Bronze Trophy
      0
Kart232425262728293031323334
PB47.19847.72745.43849.52747.527n/a48.02345.01645.642n/a46.900n/a
Avg47.19847.72746.12149.52747.527n/a48.37345.01647.011n/a47.641n/a
Count115110214040

Driver Relative Performance Analysis

Comparison of the average delta time difference against each driver,
where drivers have used the same kart number on the same day.

Deficit (Slower) Advantage (Faster)
ELD(1)
1.165
OST(4)
0.889
-0.151
OSS(4)
-0.384
JQN(2)

Interpretation Key:

  • Green Bar (Right): On average, driver ALK was faster than the other driver.
  • Red Bar (Left): On average, driver ALK was slower than the other driver.
    • ELS
    • PB Kart: 32
    • PB Date: 11th of May `25
    • Red ribbon banner
      Best PB: 48.907
    • Red ribbon banner
      Avg Best: 49.676
    • Red ribbon banner
      5 Races
    • Red ribbon banner
      3 Podiums
    • Gold Trophy
      0
    • Silver Trophy
      3
    • Bronze Trophy
      0
Kart232425262728293031323334
PB49.590n/an/a50.977n/an/an/an/an/a48.907n/an/a
Avg49.590n/an/a50.977n/an/an/an/an/a49.271n/an/a
Count100100000300

Driver Relative Performance Analysis

Comparison of the average delta time difference against each driver,
where drivers have used the same kart number on the same day.

Deficit (Slower) Advantage (Faster)
-1.067
MSA(1)
-1.308
OST(1)

Interpretation Key:

  • Green Bar (Right): On average, driver ELS was faster than the other driver.
  • Red Bar (Left): On average, driver ELS was slower than the other driver.
    • CSY
    • PB Kart: 25
    • PB Date: 24th of Mar `25
    • Red ribbon banner
      Best PB: 47.162
    • Red ribbon banner
      Avg Best: 47.76
    • Red ribbon banner
      4 Races
    • Red ribbon banner
      4 Podiums
    • Gold Trophy
      2
    • Silver Trophy
      1
    • Bronze Trophy
      1
Kart232425262728293031323334
PBn/a49.12347.162n/an/an/an/an/an/a47.309n/a47.448
Avgn/a49.12347.162n/an/an/an/an/an/a47.309n/a47.448
Count011000000101

Driver Relative Performance Analysis

Comparison of the average delta time difference against each driver,
where drivers have used the same kart number on the same day.

Deficit (Slower) Advantage (Faster)
HZR(1)
2.676
IGR(2)
0.542

Interpretation Key:

  • Green Bar (Right): On average, driver CSY was faster than the other driver.
  • Red Bar (Left): On average, driver CSY was slower than the other driver.
    • HZR
    • PB Kart: 24
    • PB Date: 10th of Mar `25
    • Red ribbon banner
      Best PB: 51.799
    • Red ribbon banner
      Avg Best: 52.733
    • Red ribbon banner
      2 Races
    • Red ribbon banner
      0 Podiums
    • Gold Trophy
      0
    • Silver Trophy
      0
    • Bronze Trophy
      0
Kart232425262728293031323334
PBn/a51.799n/an/a53.667n/an/an/an/an/an/an/a
Avgn/a51.799n/an/a53.667n/an/an/an/an/an/an/a
Count010010000000

Driver Relative Performance Analysis

Comparison of the average delta time difference against each driver,
where drivers have used the same kart number on the same day.

Deficit (Slower) Advantage (Faster)
-0.938
DNL(1)
-2.676
CSY(1)

Interpretation Key:

  • Green Bar (Right): On average, driver HZR was faster than the other driver.
  • Red Bar (Left): On average, driver HZR was slower than the other driver.
    • DNL
    • PB Kart: 34
    • PB Date: 10th of Mar `25
    • Red ribbon banner
      Best PB: 48.034
    • Red ribbon banner
      Avg Best: 50.382
    • Red ribbon banner
      2 Races
    • Red ribbon banner
      1 Podiums
    • Gold Trophy
      0
    • Silver Trophy
      1
    • Bronze Trophy
      0
Kart232425262728293031323334
PBn/an/an/an/a52.729n/an/an/an/an/an/a48.034
Avgn/an/an/an/a52.729n/an/an/an/an/an/a48.034
Count000010000001

Driver Relative Performance Analysis

Comparison of the average delta time difference against each driver,
where drivers have used the same kart number on the same day.

Deficit (Slower) Advantage (Faster)
HZR(1)
0.938

Interpretation Key:

  • Green Bar (Right): On average, driver DNL was faster than the other driver.
  • Red Bar (Left): On average, driver DNL was slower than the other driver.
    • ADR
    • PB Kart: 31
    • PB Date: 7th of Sep `25
    • Red ribbon banner
      Best PB: 44.594
    • Red ribbon banner
      Avg Best: 46.157
    • Red ribbon banner
      11 Races
    • Red ribbon banner
      8 Podiums
    • Gold Trophy
      3
    • Silver Trophy
      3
    • Bronze Trophy
      2
Kart232425262728293031323334
PB47.41947.43144.80945.164n/an/a44.614n/a44.594n/a46.52546.057
Avg47.41947.43144.80946.080n/an/a45.958n/a44.594n/a46.67146.057
Count111200201021

Driver Relative Performance Analysis

Comparison of the average delta time difference against each driver,
where drivers have used the same kart number on the same day.

Deficit (Slower) Advantage (Faster)
ELD(1)
1.462
IGR(2)
1.053
JQN(1)
0.942
MSG(3)
0.03
-0.323
SDL(2)

Interpretation Key:

  • Green Bar (Right): On average, driver ADR was faster than the other driver.
  • Red Bar (Left): On average, driver ADR was slower than the other driver.
    • MSA
    • PB Kart: 30
    • PB Date: 11th of May `25
    • Red ribbon banner
      Best PB: 48.358
    • Red ribbon banner
      Avg Best: 48.441
    • Red ribbon banner
      2 Races
    • Red ribbon banner
      0 Podiums
    • Gold Trophy
      0
    • Silver Trophy
      0
    • Bronze Trophy
      0
Kart232425262728293031323334
PB48.523n/an/an/an/an/an/a48.358n/an/an/an/a
Avg48.523n/an/an/an/an/an/a48.358n/an/an/an/a
Count100000010000

Driver Relative Performance Analysis

Comparison of the average delta time difference against each driver,
where drivers have used the same kart number on the same day.

Deficit (Slower) Advantage (Faster)
ELS(1)
1.067
-0.385
OST(1)

Interpretation Key:

  • Green Bar (Right): On average, driver MSA was faster than the other driver.
  • Red Bar (Left): On average, driver MSA was slower than the other driver.
    • JQN
    • PB Kart: 32
    • PB Date: 12th of Oct `25
    • Red ribbon banner
      Best PB: 44.385
    • Red ribbon banner
      Avg Best: 46.635
    • Red ribbon banner
      19 Races
    • Red ribbon banner
      8 Podiums
    • Gold Trophy
      5
    • Silver Trophy
      2
    • Bronze Trophy
      1
Kart232425262728293031323334
PB48.36144.76246.84746.61146.990n/a47.55745.76844.85944.385n/a45.619
Avg48.36144.82147.84747.94046.990n/a47.55747.35745.78144.484n/a45.619
Count122310133201

Driver Relative Performance Analysis

Comparison of the average delta time difference against each driver,
where drivers have used the same kart number on the same day.

Deficit (Slower) Advantage (Faster)
LCC(2)
2.164
ELD(2)
1.639
ALK(2)
0.384
IGR(4)
0.251
OST(3)
0.026
-0.942
ADR(1)
-1.319
OSS(1)
-1.615
OSN(1)

Interpretation Key:

  • Green Bar (Right): On average, driver JQN was faster than the other driver.
  • Red Bar (Left): On average, driver JQN was slower than the other driver.
    • ELD
    • PB Kart: 29
    • PB Date: 12th of Oct `25
    • Red ribbon banner
      Best PB: 46.076
    • Red ribbon banner
      Avg Best: 47.375
    • Red ribbon banner
      12 Races
    • Red ribbon banner
      1 Podiums
    • Gold Trophy
      0
    • Silver Trophy
      0
    • Bronze Trophy
      1
Kart232425262728293031323334
PBn/a46.21347.38046.77049.359n/a46.07647.07246.687n/an/a46.255
Avgn/a47.43347.38046.77049.359n/a47.79347.08046.687n/an/a46.255
Count031110221001

Driver Relative Performance Analysis

Comparison of the average delta time difference against each driver,
where drivers have used the same kart number on the same day.

Deficit (Slower) Advantage (Faster)
ASN(1)
0.063
-0.624
ABL(1)
-1.111
OST(2)
-1.134
IGR(1)
-1.165
ALK(1)
-1.462
ADR(1)
-1.623
MIO(2)
-1.639
JQN(2)
-2.81
VBW(1)

Interpretation Key:

  • Green Bar (Right): On average, driver ELD was faster than the other driver.
  • Red Bar (Left): On average, driver ELD was slower than the other driver.
    • MES
    • PB Kart: 32
    • PB Date: 31st of Aug `25
    • Red ribbon banner
      Best PB: 43.992
    • Red ribbon banner
      Avg Best: 44.802
    • Red ribbon banner
      6 Races
    • Red ribbon banner
      5 Podiums
    • Gold Trophy
      1
    • Silver Trophy
      2
    • Bronze Trophy
      2
Kart232425262728293031323334
PBn/an/an/an/an/an/a44.908n/an/a43.99245.05745.167
Avgn/an/an/an/an/an/a44.908n/an/a44.27545.09245.167
Count000000100221

Driver Relative Performance Analysis

Comparison of the average delta time difference against each driver,
where drivers have used the same kart number on the same day.

Deficit (Slower) Advantage (Faster)
OST(2)
1.542
MSG(1)
0.863
-0.281
SDL(1)

Interpretation Key:

  • Green Bar (Right): On average, driver MES was faster than the other driver.
  • Red Bar (Left): On average, driver MES was slower than the other driver.
    • SDL
    • PB Kart: 25
    • PB Date: 24th of Aug `25
    • Red ribbon banner
      Best PB: 44.221
    • Red ribbon banner
      Avg Best: 44.536
    • Red ribbon banner
      4 Races
    • Red ribbon banner
      3 Podiums
    • Gold Trophy
      2
    • Silver Trophy
      1
    • Bronze Trophy
      0
Kart232425262728293031323334
PBn/an/a44.22145.10544.540n/an/an/an/a44.277n/an/a
Avgn/an/a44.22145.10544.540n/an/an/an/a44.277n/an/a
Count001110000100

Driver Relative Performance Analysis

Comparison of the average delta time difference against each driver,
where drivers have used the same kart number on the same day.

Deficit (Slower) Advantage (Faster)
MSG(1)
0.579
ADR(2)
0.323
MES(1)
0.281

Interpretation Key:

  • Green Bar (Right): On average, driver SDL was faster than the other driver.
  • Red Bar (Left): On average, driver SDL was slower than the other driver.
    • ABL
    • PB Kart: 23
    • PB Date: 18th of Jan `26
    • Red ribbon banner
      Best PB: 44.856
    • Red ribbon banner
      Avg Best: 46.191
    • Red ribbon banner
      25 Races
    • Red ribbon banner
      9 Podiums
    • Gold Trophy
      0
    • Silver Trophy
      1
    • Bronze Trophy
      8
Kart232425262728293031323334
PB44.85645.103n/an/a45.82447.00146.317n/a46.52745.53745.71245.631
Avg45.34445.754n/an/a46.25847.00146.615n/a46.52745.53746.11046.384
Count330021701143

Driver Relative Performance Analysis

Comparison of the average delta time difference against each driver,
where drivers have used the same kart number on the same day.

Deficit (Slower) Advantage (Faster)
ASN(2)
1.255
ELD(1)
0.624
SIV(2)
0.372
FIN(2)
0.117
LFR(3)
0.076
-0.141
OST(4)
-0.158
IGR(3)
-0.354
PKA(1)
-0.884
OSS(1)

Interpretation Key:

  • Green Bar (Right): On average, driver ABL was faster than the other driver.
  • Red Bar (Left): On average, driver ABL was slower than the other driver.
    • OSN
    • PB Kart: 24
    • PB Date: 14th of Sep `25
    • Red ribbon banner
      Best PB: 44.326
    • Red ribbon banner
      Avg Best: 45.445
    • Red ribbon banner
      6 Races
    • Red ribbon banner
      4 Podiums
    • Gold Trophy
      2
    • Silver Trophy
      1
    • Bronze Trophy
      1
Kart232425262728293031323334
PBn/a44.32645.85945.14145.375n/an/an/an/a44.521n/a47.449
Avgn/a44.32645.85945.14145.375n/an/an/an/a44.521n/a47.449
Count011110000101

Driver Relative Performance Analysis

Comparison of the average delta time difference against each driver,
where drivers have used the same kart number on the same day.

Deficit (Slower) Advantage (Faster)
JQN(1)
1.615
OST(1)
1.444
OSS(2)
0.241

Interpretation Key:

  • Green Bar (Right): On average, driver OSN was faster than the other driver.
  • Red Bar (Left): On average, driver OSN was slower than the other driver.
    • PKA
    • PB Kart: 30
    • PB Date: 2nd of Nov `25
    • Red ribbon banner
      Best PB: 44.872
    • Red ribbon banner
      Avg Best: 45.987
    • Red ribbon banner
      6 Races
    • Red ribbon banner
      2 Podiums
    • Gold Trophy
      1
    • Silver Trophy
      1
    • Bronze Trophy
      0
Kart232425262728293031323334
PBn/a45.438n/an/a46.115n/an/a44.87246.703n/an/a46.679
Avgn/a45.776n/an/a46.115n/an/a44.87246.703n/an/a46.679
Count020010011001

Driver Relative Performance Analysis

Comparison of the average delta time difference against each driver,
where drivers have used the same kart number on the same day.

Deficit (Slower) Advantage (Faster)
KVU(1)
0.509
ABL(1)
0.354
HBN(1)
0.235
-0.015
OST(2)
-0.256
IGR(1)

Interpretation Key:

  • Green Bar (Right): On average, driver PKA was faster than the other driver.
  • Red Bar (Left): On average, driver PKA was slower than the other driver.
    • KVU
    • PB Kart: 29
    • PB Date: 19th of Oct `25
    • Red ribbon banner
      Best PB: 44.923
    • Red ribbon banner
      Avg Best: 46.726
    • Red ribbon banner
      9 Races
    • Red ribbon banner
      5 Podiums
    • Gold Trophy
      1
    • Silver Trophy
      2
    • Bronze Trophy
      2
Kart232425262728293031323334
PB48.50045.813n/an/a47.582n/a44.92346.86647.42645.06948.410n/a
Avg48.50045.880n/an/a47.582n/a44.92346.86647.42645.06948.410n/a
Count120010111110

Driver Relative Performance Analysis

Comparison of the average delta time difference against each driver,
where drivers have used the same kart number on the same day.

Deficit (Slower) Advantage (Faster)
FCR(1)
1.657
MIO(1)
0.519
VBW(1)
0.139
-0.217
OST(1)
-0.509
PKA(1)
-0.882
HBN(1)
-0.983
FCD(1)

Interpretation Key:

  • Green Bar (Right): On average, driver KVU was faster than the other driver.
  • Red Bar (Left): On average, driver KVU was slower than the other driver.
    • VBW
    • PB Kart: 24
    • PB Date: 21st of Dec `25
    • Red ribbon banner
      Best PB: 45.755
    • Red ribbon banner
      Avg Best: 46.4
    • Red ribbon banner
      6 Races
    • Red ribbon banner
      1 Podiums
    • Gold Trophy
      0
    • Silver Trophy
      1
    • Bronze Trophy
      0
Kart232425262728293031323334
PBn/a45.755n/an/a45.960n/an/a47.005n/a45.864n/an/a
Avgn/a45.755n/an/a46.591n/an/a47.005n/a45.864n/an/a
Count010030010100

Driver Relative Performance Analysis

Comparison of the average delta time difference against each driver,
where drivers have used the same kart number on the same day.

Deficit (Slower) Advantage (Faster)
ELD(1)
2.81
-0.104
MIO(1)
-0.139
KVU(1)
-0.416
AKD(1)
-0.683
OSS(1)
-0.868
OST(1)

Interpretation Key:

  • Green Bar (Right): On average, driver VBW was faster than the other driver.
  • Red Bar (Left): On average, driver VBW was slower than the other driver.
    • AKD
    • PB Kart: 24
    • PB Date: 9th of Nov `25
    • Red ribbon banner
      Best PB: 45.559
    • Red ribbon banner
      Avg Best: 46.862
    • Red ribbon banner
      17 Races
    • Red ribbon banner
      1 Podiums
    • Gold Trophy
      0
    • Silver Trophy
      0
    • Bronze Trophy
      1
Kart232425262728293031323334
PB46.24445.55948.47146.77646.849n/a46.143n/an/an/a45.83845.751
Avg46.81546.16748.47146.77647.284n/a46.143n/an/an/a46.80046.742
Count321130100033

Driver Relative Performance Analysis

Comparison of the average delta time difference against each driver,
where drivers have used the same kart number on the same day.

Deficit (Slower) Advantage (Faster)
VBW(1)
0.416
JPS(2)
0.315
ASN(2)
0.263
-0.834
FCR(1)
-1.987
OSS(3)
-3.044
YMV(1)

Interpretation Key:

  • Green Bar (Right): On average, driver AKD was faster than the other driver.
  • Red Bar (Left): On average, driver AKD was slower than the other driver.
    • HBN
    • PB Kart: 27
    • PB Date: 7th of Dec `25
    • Red ribbon banner
      Best PB: 44.619
    • Red ribbon banner
      Avg Best: 46.073
    • Red ribbon banner
      6 Races
    • Red ribbon banner
      2 Podiums
    • Gold Trophy
      0
    • Silver Trophy
      0
    • Bronze Trophy
      2
Kart232425262728293031323334
PB45.707n/an/an/a44.619n/an/a45.10746.876n/a47.528n/a
Avg46.155n/an/an/a44.619n/an/a45.10746.876n/a47.528n/a
Count200010011010

Driver Relative Performance Analysis

Comparison of the average delta time difference against each driver,
where drivers have used the same kart number on the same day.

Deficit (Slower) Advantage (Faster)
KVU(1)
0.882
OST(1)
0.82
MIO(1)
0.721
OSS(1)
0.505
-0.138
IGR(1)
-0.235
PKA(1)

Interpretation Key:

  • Green Bar (Right): On average, driver HBN was faster than the other driver.
  • Red Bar (Left): On average, driver HBN was slower than the other driver.
    • MIO
    • PB Kart: 29
    • PB Date: 15th of Feb `26
    • Red ribbon banner
      Best PB: 44.558
    • Red ribbon banner
      Avg Best: 45.7
    • Red ribbon banner
      17 Races
    • Red ribbon banner
      11 Podiums
    • Gold Trophy
      3
    • Silver Trophy
      3
    • Bronze Trophy
      5
Kart232425262728293031323334
PB46.42845.196n/an/a46.038n/a44.55845.41045.52744.908n/a45.153
Avg46.42845.371n/an/a46.390n/a45.24446.07445.52745.367n/a45.458
Count130030221302

Driver Relative Performance Analysis

Comparison of the average delta time difference against each driver,
where drivers have used the same kart number on the same day.

Deficit (Slower) Advantage (Faster)
ELD(2)
1.623
LCC(1)
0.879
LFR(2)
0.673
VBW(1)
0.104
-0.015
OSS(3)
-0.368
IGR(2)
-0.519
KVU(1)
-0.721
HBN(1)

Interpretation Key:

  • Green Bar (Right): On average, driver MIO was faster than the other driver.
  • Red Bar (Left): On average, driver MIO was slower than the other driver.
    • LCC
    • PB Kart: 32
    • PB Date: 23rd of Nov `25
    • Red ribbon banner
      Best PB: 46.484
    • Red ribbon banner
      Avg Best: 48.003
    • Red ribbon banner
      10 Races
    • Red ribbon banner
      0 Podiums
    • Gold Trophy
      0
    • Silver Trophy
      0
    • Bronze Trophy
      0
Kart232425262728293031323334
PBn/an/a51.15647.30346.815n/a47.44449.023n/a46.484n/an/a
Avgn/an/a51.15647.99146.981n/a47.44449.023n/a46.484n/an/a
Count001420110100

Driver Relative Performance Analysis

Comparison of the average delta time difference against each driver,
where drivers have used the same kart number on the same day.

Deficit (Slower) Advantage (Faster)
-0.319
AAJ(1)
-0.879
MIO(1)
-2.077
OST(1)
-2.103
IGR(1)
-2.164
JQN(2)

Interpretation Key:

  • Green Bar (Right): On average, driver LCC was faster than the other driver.
  • Red Bar (Left): On average, driver LCC was slower than the other driver.
    • LFR
    • PB Kart: 24
    • PB Date: 18th of Jan `26
    • Red ribbon banner
      Best PB: 44.382
    • Red ribbon banner
      Avg Best: 45.845
    • Red ribbon banner
      14 Races
    • Red ribbon banner
      8 Podiums
    • Gold Trophy
      1
    • Silver Trophy
      7
    • Bronze Trophy
      0
Kart232425262728293031323334
PB44.93344.382n/a46.631n/an/a44.50947.82247.34645.06046.21645.909
Avg45.76544.382n/a46.698n/an/a44.80347.82247.34645.06046.21645.909
Count310200311111

Driver Relative Performance Analysis

Comparison of the average delta time difference against each driver,
where drivers have used the same kart number on the same day.

Deficit (Slower) Advantage (Faster)
ASN(2)
0.88
-0.076
ABL(3)
-0.359
OSS(1)
-0.431
IGR(1)
-0.673
MIO(2)

Interpretation Key:

  • Green Bar (Right): On average, driver LFR was faster than the other driver.
  • Red Bar (Left): On average, driver LFR was slower than the other driver.
    • JPS
    • PB Kart: 24
    • PB Date: 9th of Nov `25
    • Red ribbon banner
      Best PB: 46.488
    • Red ribbon banner
      Avg Best: 46.949
    • Red ribbon banner
      2 Races
    • Red ribbon banner
      0 Podiums
    • Gold Trophy
      0
    • Silver Trophy
      0
    • Bronze Trophy
      0
Kart232425262728293031323334
PB47.41146.488n/an/an/an/an/an/an/an/an/an/a
Avg47.41146.488n/an/an/an/an/an/an/an/an/an/a
Count110000000000

Driver Relative Performance Analysis

Comparison of the average delta time difference against each driver,
where drivers have used the same kart number on the same day.

Deficit (Slower) Advantage (Faster)
-0.315
AKD(2)

Interpretation Key:

  • Green Bar (Right): On average, driver JPS was faster than the other driver.
  • Red Bar (Left): On average, driver JPS was slower than the other driver.
    • ASN
    • PB Kart: 33
    • PB Date: 15th of Feb `26
    • Red ribbon banner
      Best PB: 46.488
    • Red ribbon banner
      Avg Best: 47.249
    • Red ribbon banner
      14 Races
    • Red ribbon banner
      0 Podiums
    • Gold Trophy
      0
    • Silver Trophy
      0
    • Bronze Trophy
      0
Kart232425262728293031323334
PB46.96646.673n/a46.557n/an/a47.245n/an/a47.02946.48848.209
Avg47.48146.673n/a46.695n/an/a47.245n/an/a47.04947.00448.315
Count310200100232

Driver Relative Performance Analysis

Comparison of the average delta time difference against each driver,
where drivers have used the same kart number on the same day.

Deficit (Slower) Advantage (Faster)
FCR(1)
0.44
-0.063
ELD(1)
-0.263
AKD(2)
-0.88
LFR(2)
-0.919
MSG(1)
-1.255
ABL(2)
-1.289
OSS(1)
-1.324
OST(4)

Interpretation Key:

  • Green Bar (Right): On average, driver ASN was faster than the other driver.
  • Red Bar (Left): On average, driver ASN was slower than the other driver.
    • AAJ
    • PB Kart: 24
    • PB Date: 30th of Nov `25
    • Red ribbon banner
      Best PB: 45.924
    • Red ribbon banner
      Avg Best: 47.139
    • Red ribbon banner
      2 Races
    • Red ribbon banner
      1 Podiums
    • Gold Trophy
      0
    • Silver Trophy
      1
    • Bronze Trophy
      0
Kart232425262728293031323334
PBn/a45.924n/a48.353n/an/an/an/an/an/an/an/a
Avgn/a45.924n/a48.353n/an/an/an/an/an/an/an/a
Count010100000000

Driver Relative Performance Analysis

Comparison of the average delta time difference against each driver,
where drivers have used the same kart number on the same day.

Deficit (Slower) Advantage (Faster)
LCC(1)
0.319
-0.571
IGR(1)

Interpretation Key:

  • Green Bar (Right): On average, driver AAJ was faster than the other driver.
  • Red Bar (Left): On average, driver AAJ was slower than the other driver.
    • SIV
    • PB Kart: 29
    • PB Date: 21st of Dec `25
    • Red ribbon banner
      Best PB: 46.293
    • Red ribbon banner
      Avg Best: 46.503
    • Red ribbon banner
      2 Races
    • Red ribbon banner
      0 Podiums
    • Gold Trophy
      0
    • Silver Trophy
      0
    • Bronze Trophy
      0
Kart232425262728293031323334
PBn/an/an/an/an/an/a46.293n/an/an/a46.714n/a
Avgn/an/an/an/an/an/a46.293n/an/an/a46.714n/a
Count000000100010

Driver Relative Performance Analysis

Comparison of the average delta time difference against each driver,
where drivers have used the same kart number on the same day.

Deficit (Slower) Advantage (Faster)
-0.372
ABL(2)

Interpretation Key:

  • Green Bar (Right): On average, driver SIV was faster than the other driver.
  • Red Bar (Left): On average, driver SIV was slower than the other driver.
    • FCR
    • PB Kart: 26
    • PB Date: 15th of Feb `26
    • Red ribbon banner
      Best PB: 45.942
    • Red ribbon banner
      Avg Best: 47.29
    • Red ribbon banner
      10 Races
    • Red ribbon banner
      4 Podiums
    • Gold Trophy
      0
    • Silver Trophy
      3
    • Bronze Trophy
      1
Kart232425262728293031323334
PBn/a46.847n/a45.942n/an/a46.396n/a49.94648.66246.92846.294
Avgn/a47.084n/a45.942n/an/a46.396n/a49.94648.66246.92846.887
Count030100101112

Driver Relative Performance Analysis

Comparison of the average delta time difference against each driver,
where drivers have used the same kart number on the same day.

Deficit (Slower) Advantage (Faster)
AKD(1)
0.834
AYB(1)
0.254
-0.44
ASN(1)
-1.657
KVU(1)
-2.467
OST(4)
-4.125
OSS(1)

Interpretation Key:

  • Green Bar (Right): On average, driver FCR was faster than the other driver.
  • Red Bar (Left): On average, driver FCR was slower than the other driver.
    • FCD
    • PB Kart: 29
    • PB Date: 1st of Feb `26
    • Red ribbon banner
      Best PB: 44.851
    • Red ribbon banner
      Avg Best: 46.267
    • Red ribbon banner
      6 Races
    • Red ribbon banner
      3 Podiums
    • Gold Trophy
      1
    • Silver Trophy
      1
    • Bronze Trophy
      1
Kart232425262728293031323334
PBn/a45.699n/an/an/a48.18244.851n/a46.443n/an/an/a
Avgn/a45.699n/an/an/a48.18245.082n/a46.780n/an/an/a
Count010001202000

Driver Relative Performance Analysis

Comparison of the average delta time difference against each driver,
where drivers have used the same kart number on the same day.

Deficit (Slower) Advantage (Faster)
KVU(1)
0.983
OST(1)
0.213

Interpretation Key:

  • Green Bar (Right): On average, driver FCD was faster than the other driver.
  • Red Bar (Left): On average, driver FCD was slower than the other driver.
    • DWT
    • PB Kart: 34
    • PB Date: 15th of Feb `26
    • Red ribbon banner
      Best PB: 45.605
    • Red ribbon banner
      Avg Best: 45.958
    • Red ribbon banner
      2 Races
    • Red ribbon banner
      1 Podiums
    • Gold Trophy
      0
    • Silver Trophy
      0
    • Bronze Trophy
      1
Kart232425262728293031323334
PBn/an/an/an/an/an/an/an/an/a46.312n/a45.605
Avgn/an/an/an/an/an/an/an/an/a46.312n/a45.605
Count000000000101

Driver Relative Performance Analysis

Comparison of the average delta time difference against each driver,
where drivers have used the same kart number on the same day.

Deficit (Slower) Advantage (Faster)
-0.185
OST(1)
-1.124
OSS(1)

Interpretation Key:

  • Green Bar (Right): On average, driver DWT was faster than the other driver.
  • Red Bar (Left): On average, driver DWT was slower than the other driver.
    • FIN
    • PB Kart: 31
    • PB Date: 15th of Feb `26
    • Red ribbon banner
      Best PB: 46.453
    • Red ribbon banner
      Avg Best: 46.726
    • Red ribbon banner
      2 Races
    • Red ribbon banner
      0 Podiums
    • Gold Trophy
      0
    • Silver Trophy
      0
    • Bronze Trophy
      0
Kart232425262728293031323334
PBn/an/an/an/a46.998n/an/an/a46.453n/an/an/a
Avgn/an/an/an/a46.998n/an/an/a46.453n/an/an/a
Count000010001000

Driver Relative Performance Analysis

Comparison of the average delta time difference against each driver,
where drivers have used the same kart number on the same day.

Deficit (Slower) Advantage (Faster)
-0.117
ABL(2)

Interpretation Key:

  • Green Bar (Right): On average, driver FIN was faster than the other driver.
  • Red Bar (Left): On average, driver FIN was slower than the other driver.
    • YMV
    • PB Kart: 31
    • PB Date: 16th of Mar `26
    • Red ribbon banner
      Best PB: 44.521
    • Red ribbon banner
      Avg Best: 46.224
    • Red ribbon banner
      8 Races
    • Red ribbon banner
      5 Podiums
    • Gold Trophy
      3
    • Silver Trophy
      2
    • Bronze Trophy
      0
Kart232425262728293031323334
PBn/an/a45.427n/a47.13147.71247.323n/a44.52144.80945.145n/a
Avgn/an/a45.427n/a47.42747.71247.323n/a44.52144.80945.145n/a
Count001021101110

Driver Relative Performance Analysis

Comparison of the average delta time difference against each driver,
where drivers have used the same kart number on the same day.

Deficit (Slower) Advantage (Faster)
AKD(1)
3.044
AYB(3)
2.224
OST(2)
0.325

Interpretation Key:

  • Green Bar (Right): On average, driver YMV was faster than the other driver.
  • Red Bar (Left): On average, driver YMV was slower than the other driver.
    • AYB
    • PB Kart: 29
    • PB Date: 16th of Mar `26
    • Red ribbon banner
      Best PB: 46.65
    • Red ribbon banner
      Avg Best: 46.949
    • Red ribbon banner
      4 Races
    • Red ribbon banner
      2 Podiums
    • Gold Trophy
      0
    • Silver Trophy
      0
    • Bronze Trophy
      2
Kart232425262728293031323334
PBn/an/an/an/an/an/a46.650n/a46.89947.09647.151n/a
Avgn/an/an/an/an/an/a46.650n/a46.89947.09647.151n/a
Count000000101110

Driver Relative Performance Analysis

Comparison of the average delta time difference against each driver,
where drivers have used the same kart number on the same day.

Deficit (Slower) Advantage (Faster)
-0.254
FCR(1)
-1.624
OST(1)
-2.224
YMV(3)

Interpretation Key:

  • Green Bar (Right): On average, driver AYB was faster than the other driver.
  • Red Bar (Left): On average, driver AYB was slower than the other driver.
    • AVH
    • PB Kart: 24
    • PB Date: 16th of Mar `26
    • Red ribbon banner
      Best PB: 47.32
    • Red ribbon banner
      Avg Best: 47.819
    • Red ribbon banner
      2 Races
    • Red ribbon banner
      0 Podiums
    • Gold Trophy
      0
    • Silver Trophy
      0
    • Bronze Trophy
      0
Kart232425262728293031323334
PBn/a47.320n/an/an/an/an/an/an/an/an/an/a
Avgn/a47.819n/an/an/an/an/an/an/an/an/an/a
Count020000000000
Alas we have no comparison data to show dor this driver at this time.
    • SDL
    • PB Kart: 29
    • PB Date: 30th of Mar `26
    • Red ribbon banner
      Best PB: 47.739
    • Red ribbon banner
      Avg Best: 48.372
    • Red ribbon banner
      2 Races
    • Red ribbon banner
      2 Podiums
    • Gold Trophy
      0
    • Silver Trophy
      0
    • Bronze Trophy
      2
Kart232425262728293031323334
PBn/an/a49.004n/an/an/a47.739n/an/an/an/an/a
Avgn/an/a49.004n/an/an/a47.739n/an/an/an/an/a
Count001000100000
Alas we have no comparison data to show dor this driver at this time.


Driver Personal Best Times

Note: These results only reflect events where we have attended. The tables show each driver‘s Personal Bests (PBs) for each kart where at least one time has been recorded. The resuls are restricted to the 15 most prolific drivers (most results) who have results in the last 18 months:

OST

KartTime
2944.860
2444.892
3244.996
2645.052
3445.111
3345.436
2345.734
3146.002
2746.126
3046.224
2547.063
2855.287

OSS

KartTime
2444.023
2944.172
2344.198
3244.401
3444.419
3144.477
3344.537
2745.124
3046.291
2546.859
2648.985

IGR

KartTime
2745.242
3445.308
2945.341
3245.348
2445.353
3145.513
3045.684
2846.340
3346.747
2347.358
2547.390
2647.393

MSG

KartTime
2444.675
3244.855
3445.091
2745.119
3345.148
3145.252
2545.493
3045.611
2645.965
2346.047
2947.644

ABL

KartTime
2344.856
2445.103
3245.537
3445.631
3345.712
2745.824
2946.317
3146.527
2847.001

ALK

KartTime
3045.016
2545.438
3145.642
3346.900
2347.198
2747.527
2447.727
2948.023
2649.527

JQN

KartTime
3244.385
2444.762
3144.859
3445.619
3045.768
2646.611
2546.847
2746.990
2947.557
2348.361

MIO

KartTime
2944.558
3244.908
3445.153
2445.196
3045.410
3145.527
2746.038
2346.428

AKD

KartTime
2445.559
3445.751
3345.838
2946.143
2346.244
2646.776
2746.849
2548.471

LFR

KartTime
2444.382
2944.509
2344.933
3245.060
3445.909
3346.216
2646.631
3147.346
3047.822

ASN

KartTime
3346.488
2646.557
2446.673
2346.966
3247.029
2947.245
3448.209

ELD

KartTime
2946.076
2446.213
3446.255
3146.687
2646.770
3047.072
2547.380
2749.359

ADR

KartTime
3144.594
2944.614
2544.809
2645.164
3446.057
3346.525
2347.419
2447.431

FCR

KartTime
2645.942
3446.294
2946.396
2446.847
3346.928
3248.662
3149.946

LCC

KartTime
3246.484
2746.815
2647.303
2947.444
3049.023
2551.156

Cadet Kart Fastest Lap Trophies

Note: These results only reflect events we were at, ignoring all the adult kart times, and is based on the fastest lap time regardless of the event type. For the purpose of this table, we ignore any events with only one cadet kart.
Driver
  Golds   
  Silvers  
  Bronzes  
Out ofTop 3FromTo
OSS291566181.97%9th of Feb `2529th of Mar `26
OST1519209556.84%9th of Feb `2512th of Apr `26
IGR111054854.17%9th of Feb `2529th of Mar `26
ALK6302045%10th of Mar `259th of Nov `25
MSG59153876.32%20th of Apr `2515th of Mar `26
JQN5211942.11%29th of Jun `252nd of Nov `25
MIO3351764.71%2nd of Nov `2512th of Apr `26
ADR3321172.73%20th of Apr `2512th of Oct `25
YMV320862.5%15th of Mar `2612th of Apr `26
CSY2114100%10th of Mar `2524th of Mar `25
OSN211666.67%31st of Aug `2514th of Sep `25
SDL210475%18th of Aug `2524th of Aug `25
LFR1701457.14%9th of Nov `2515th of Feb `26
KVU122955.56%19th of Oct `2512th of Apr `26
MES122683.33%18th of Aug `2531st of Aug `25
FCD111650%1st of Feb `2612th of Apr `26
PKA110633.33%12th of Oct `252nd of Nov `25
LLY101366.67%4th of May `2519th of Oct `25
FCR0311040%18th of Jan `2630th of Mar `26
ELS030560%2nd of Mar `2511th of May `25
ABL0182536%31st of Aug `2529th of Mar `26
VBW010616.67%26th of Oct `2521st of Dec `25
DNL010250%10th of Mar `2510th of Mar `25
AAJ010250%30th of Nov `2530th of Nov `25
SDL0022100%30th of Mar `2630th of Mar `26
AYB002450%16th of Mar `2630th of Mar `26
HBN002633.33%2nd of Nov `257th of Dec `25
ELD001128.33%27th of Jul `251st of Feb `26
DWT001250%15th of Feb `2615th of Feb `26
AKD001175.88%26th of Oct `2512th of Apr `26
SIV00020%21st of Dec `2521st of Dec `25
ASN000140%9th of Nov `2512th of Apr `26
JPS00020%9th of Nov `259th of Nov `25
LCC000100%2nd of Nov `257th of Dec `25
FIN00020%15th of Feb `2615th of Feb `26
HZR00020%10th of Mar `2510th of Mar `25
AVH00020%16th of Mar `2616th of Mar `26
MSA00020%11th of May `2511th of May `25

Karts

Fastest times per kart number for each of the divers in this test.

Note: Average time shown for each driver-kart combination at this venue, with the count of such laps in brackets.
Driver232425262728293031323334
OST47.547 (7)47.016 (10)48.730 (6)46.362 (11)48.370 (7)55.287 (1)46.549 (12)48.066 (11)47.481 (4)46.689 (9)47.040 (9)46.455 (8)
OSS45.658 (3)45.545 (6)46.937 (3)49.024 (2)46.581 (7)45.663 (4)47.468 (3)45.495 (3)45.478 (13)46.962 (11)45.746 (6)
IGR47.978 (3)47.078 (4)47.390 (1)47.393 (1)46.334 (5)46.530 (2)46.926 (9)46.659 (6)47.470 (6)46.563 (2)47.246 (5)46.125 (4)
MSG46.896 (2)46.858 (3)46.683 (2)46.815 (4)47.255 (5)47.644 (1)47.284 (5)46.182 (2)46.500 (5)46.765 (7)45.300 (2)
LLY48.066 (1)46.664 (1)47.647 (1)
ALK47.198 (1)47.727 (1)46.121 (5)49.527 (1)47.527 (1)48.373 (2)45.016 (1)47.011 (4)47.641 (4)
ELS49.590 (1)50.977 (1)49.271 (3)
CSY49.123 (1)47.162 (1)47.309 (1)47.448 (1)
HZR51.799 (1)53.667 (1)
DNL52.729 (1)48.034 (1)
ADR47.419 (1)47.431 (1)44.809 (1)46.080 (2)45.958 (2)44.594 (1)46.671 (2)46.057 (1)
MSA48.523 (1)48.358 (1)
JQN48.361 (1)44.821 (2)47.847 (2)47.940 (3)46.990 (1)47.557 (1)47.357 (3)45.781 (3)44.484 (2)45.619 (1)
ELD47.433 (3)47.380 (1)46.770 (1)49.359 (1)47.793 (2)47.080 (2)46.687 (1)46.255 (1)
MES44.908 (1)44.275 (2)45.092 (2)45.167 (1)
SDL44.221 (1)45.105 (1)44.540 (1)44.277 (1)
ABL45.344 (3)45.754 (3)46.258 (2)47.001 (1)46.615 (7)46.527 (1)45.537 (1)46.110 (4)46.384 (3)
OSN44.326 (1)45.859 (1)45.141 (1)45.375 (1)44.521 (1)47.449 (1)
PKA45.776 (2)46.115 (1)44.872 (1)46.703 (1)46.679 (1)
KVU48.500 (1)45.880 (2)47.582 (1)44.923 (1)46.866 (1)47.426 (1)45.069 (1)48.410 (1)
VBW45.755 (1)46.591 (3)47.005 (1)45.864 (1)
AKD46.815 (3)46.167 (2)48.471 (1)46.776 (1)47.284 (3)46.143 (1)46.800 (3)46.742 (3)
HBN46.155 (2)44.619 (1)45.107 (1)46.876 (1)47.528 (1)
MIO46.428 (1)45.371 (3)46.390 (3)45.244 (2)46.074 (2)45.527 (1)45.367 (3)45.458 (2)
LCC51.156 (1)47.991 (4)46.981 (2)47.444 (1)49.023 (1)46.484 (1)
LFR45.765 (3)44.382 (1)46.698 (2)44.803 (3)47.822 (1)47.346 (1)45.060 (1)46.216 (1)45.909 (1)
JPS47.411 (1)46.488 (1)
ASN47.481 (3)46.673 (1)46.695 (2)47.245 (1)47.049 (2)47.004 (3)48.315 (2)
AAJ45.924 (1)48.353 (1)
SIV46.293 (1)46.714 (1)
FCR47.084 (3)45.942 (1)46.396 (1)49.946 (1)48.662 (1)46.928 (1)46.887 (2)
FCD45.699 (1)48.182 (1)45.082 (2)46.780 (2)
DWT46.312 (1)45.605 (1)
FIN46.998 (1)46.453 (1)
YMV45.427 (1)47.427 (2)47.712 (1)47.323 (1)44.521 (1)44.809 (1)45.145 (1)
AYB46.650 (1)46.899 (1)47.096 (1)47.151 (1)
AVH47.819 (2)
SDL49.004 (1)47.739 (1)

Note: Fastest time shown for each driver-kart combination at this venue, with the count of such laps in brackets.
Driver232425262728293031323334
OST45.734 (7)44.892 (10)47.063 (6)45.052 (11)46.126 (7)55.287 (1)44.860 (12)46.224 (11)46.002 (4)44.996 (9)45.436 (9)45.111 (8)
OSS44.198 (3)44.023 (6)46.859 (3)48.985 (2)45.124 (7)44.172 (4)46.291 (3)44.477 (3)44.401 (13)44.537 (11)44.419 (6)
IGR47.358 (3)45.353 (4)47.390 (1)47.393 (1)45.242 (5)46.340 (2)45.341 (9)45.684 (6)45.513 (6)45.348 (2)46.747 (5)45.308 (4)
MSG46.047 (2)44.675 (3)45.493 (2)45.965 (4)45.119 (5)47.644 (1)45.611 (5)45.252 (2)44.855 (5)45.148 (7)45.091 (2)
LLY48.066 (1)46.664 (1)47.647 (1)
ALK47.198 (1)47.727 (1)45.438 (5)49.527 (1)47.527 (1)48.023 (2)45.016 (1)45.642 (4)46.900 (4)
ELS49.590 (1)50.977 (1)48.907 (3)
CSY49.123 (1)47.162 (1)47.309 (1)47.448 (1)
HZR51.799 (1)53.667 (1)
DNL52.729 (1)48.034 (1)
ADR47.419 (1)47.431 (1)44.809 (1)45.164 (2)44.614 (2)44.594 (1)46.525 (2)46.057 (1)
MSA48.523 (1)48.358 (1)
JQN48.361 (1)44.762 (2)46.847 (2)46.611 (3)46.990 (1)47.557 (1)45.768 (3)44.859 (3)44.385 (2)45.619 (1)
ELD46.213 (3)47.380 (1)46.770 (1)49.359 (1)46.076 (2)47.072 (2)46.687 (1)46.255 (1)
MES44.908 (1)43.992 (2)45.057 (2)45.167 (1)
SDL44.221 (1)45.105 (1)44.540 (1)44.277 (1)
ABL44.856 (3)45.103 (3)45.824 (2)47.001 (1)46.317 (7)46.527 (1)45.537 (1)45.712 (4)45.631 (3)
OSN44.326 (1)45.859 (1)45.141 (1)45.375 (1)44.521 (1)47.449 (1)
PKA45.438 (2)46.115 (1)44.872 (1)46.703 (1)46.679 (1)
KVU48.500 (1)45.813 (2)47.582 (1)44.923 (1)46.866 (1)47.426 (1)45.069 (1)48.410 (1)
VBW45.755 (1)45.960 (3)47.005 (1)45.864 (1)
AKD46.244 (3)45.559 (2)48.471 (1)46.776 (1)46.849 (3)46.143 (1)45.838 (3)45.751 (3)
HBN45.707 (2)44.619 (1)45.107 (1)46.876 (1)47.528 (1)
MIO46.428 (1)45.196 (3)46.038 (3)44.558 (2)45.410 (2)45.527 (1)44.908 (3)45.153 (2)
LCC51.156 (1)47.303 (4)46.815 (2)47.444 (1)49.023 (1)46.484 (1)
LFR44.933 (3)44.382 (1)46.631 (2)44.509 (3)47.822 (1)47.346 (1)45.060 (1)46.216 (1)45.909 (1)
JPS47.411 (1)46.488 (1)
ASN46.966 (3)46.673 (1)46.557 (2)47.245 (1)47.029 (2)46.488 (3)48.209 (2)
AAJ45.924 (1)48.353 (1)
SIV46.293 (1)46.714 (1)
FCR46.847 (3)45.942 (1)46.396 (1)49.946 (1)48.662 (1)46.928 (1)46.294 (2)
FCD45.699 (1)48.182 (1)44.851 (2)46.443 (2)
DWT46.312 (1)45.605 (1)
FIN46.998 (1)46.453 (1)
YMV45.427 (1)47.131 (2)47.712 (1)47.323 (1)44.521 (1)44.809 (1)45.145 (1)
AYB46.650 (1)46.899 (1)47.096 (1)47.151 (1)
AVH47.320 (2)
SDL49.004 (1)47.739 (1)

Venues

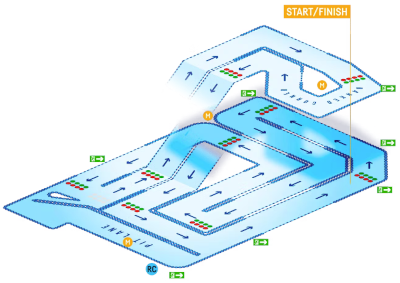
List of racing venues

TeamSport Leicester

Key Information

Karts are200cc biz petrol
AddressUnit 8a
2 New Star Road
LE4 9JD
Websitehttps://www.team-sport.co.uk/go-kart-tracks/leicester
Emailinfo@email.team-sport.co.uk
Phone01252732300
W3Whttps://w3w.co/bond.cried.vivid
NotesWe have found the staff to be very helpful and insightful. As my son is part of the Academy Programme, he has moved from beginner, through intermediate to advanced under the careful guidance of the instructors. The site and the facilities are clean and well maintained, although the car park can be busy at times.
Track layout at TeamSport Leicester

Track layout courtesy of their website

Venue Photo

Venue photo of TeamSport Leicester

Inside Photo

Inside photo of TeamSport Leicester
  • Fastest Karts

    KartTimeDrvrDate
    3144.521YMV16-03-26
    3244.809YMV30-03-26
    2645.052OST01-03-26
    2445.103ABL29-03-26
    3445.111OST30-03-26
    3345.145YMV30-03-26
    3045.410MIO01-02-26
    2545.427YMV12-04-26
    2745.591IGR29-03-26
    2346.244AKD29-03-26
    2946.396FCR16-03-26
    2846.720IGR15-03-26
  • Fastest Avg Time

    KartAverageMax Ct
    2645.3315
    3245.3935
    2445.8875
    3345.9465
    2746.4165
    3146.4815
    3046.6005
    3446.8365
    2947.1405
    2347.4205
    2548.9045
    2848.9805

All Driver Performance Delta (Relative to Event Average)

Waiting...

Interpretation Key:

  • The horizontal center line marks the average time for each event.
  • Where a drivers curve is in the negative, they are faster than average.
  • The further "higher" and consistent the drivers curver is from the average the better.
  • Tbe graph is prefiltered to only include that last months data, where at least 8 times have been recorded..

Waiting for graph
little kart image